 Chat with all AI
Debug code with AI
Paste the failing code and the error. The AI finds the root cause first, then suggests a minimal fix. Faster debugging with a model that explains why the bug happens.
How to do it
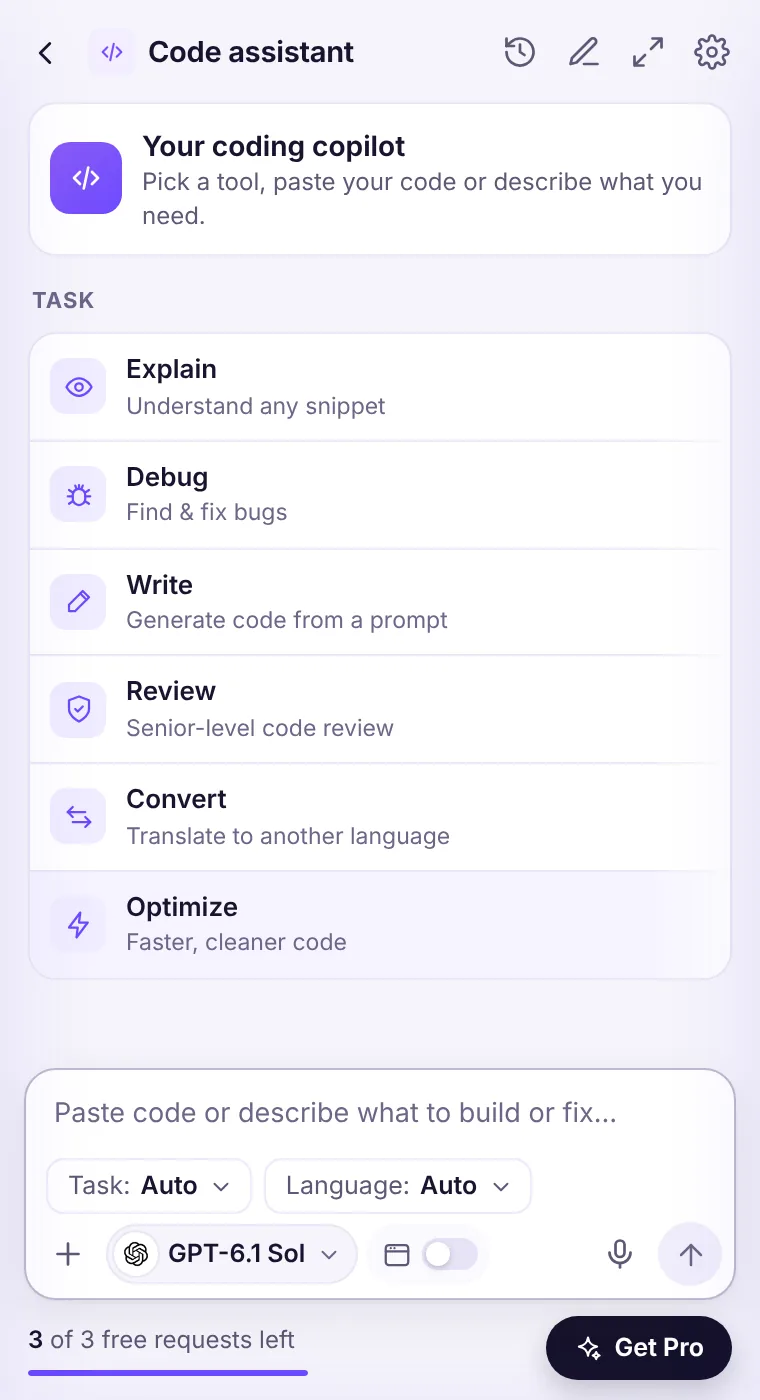
- Open the side panel and choose Code on the home screen.
- Pick the Debug task and a language (or Auto).
- Paste your code or select it on the page and right-click → Explain this code.
- Ask follow-ups or switch models to compare.
Example prompt
Here's my code and the error. Find the root cause before proposing a fix, and keep the fix minimal.
Tips for better results
- Include the exact error message and what you expected.
- Mention versions (Node 22, Python 3.13, React 19).
- Ask for the reasoning first, then the code.
- For important code, ask a second model to review the first answer.
See it in the extension
Frequently asked questions
Which model is best for debug code?
Claude Opus 5.5 and GPT-6.1 Sol are the strongest for hard cases; Claude Sonnet 5.5 and GPT-6.1 Terra are faster for everyday use.
Does it support my language?
Yes — pick from JavaScript, TypeScript, Python, Java, C#, C++, Go, Rust, PHP, Ruby, Swift, Kotlin, Dart, SQL, HTML/CSS, React, Vue, Node.js, Bash or Auto.
Is my code stored?
No. Code you send is processed to create the answer and not stored on our servers. Don't paste secrets like API keys.
Every top AI model, one side panel
Try GPT-6.1, Claude, Muse and Grok free — 3 requests, no card needed.